Overview:
This section, we begin our industry comparison with two paralleling data sets on consumer expenditure in both the movie theater and full-service restaurant industries. Both data sets are visualized, then manipulated to form a third visualization. The guiding question for this beginning section of our data analysis is: Who bounced back better after the COVID-19 pandemic: the movie theater industry or the full-service restaurant industry? See our visualizations and insights below to find out!
Movie Theater Industry
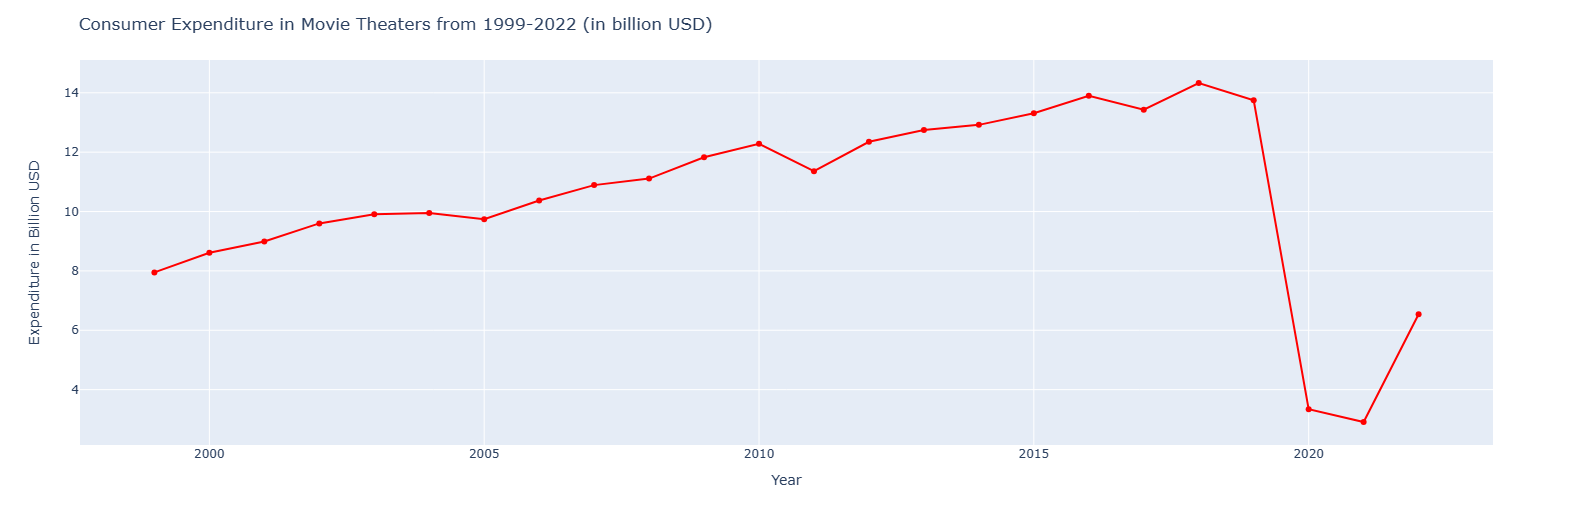
The line graph to the right shows consumer expenditure in the movie theater industry from 1999 to 2022. The values are in billion USD. In this graph, we see the strong growth of the industry from from 1999 up until the COVID pandemic, where there is a drastic drop that parallels the drop of the entire US economy. This drop is not unusual, but the indsutry's recovering since is unusual. While the rest of the economy has recovered, the movie theater industry is performing at less than half of where it was pre-COVID, as seen in the final value for 2022 in our visualization.
Full-Service Restaurant Industry
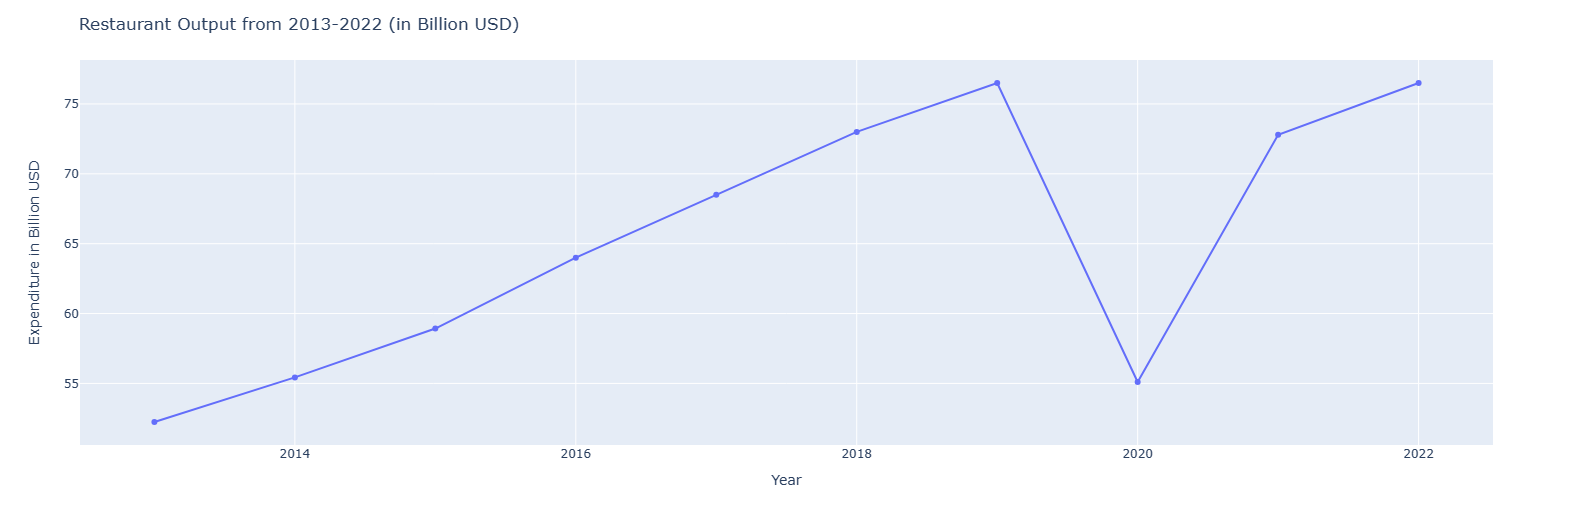
The visualization to the left is a line graph of the full-service restaurant industry's annual output from 2013-2022. In this graph, we see the same economic drop as experienced by the movie theater industry. The different here, however, is that the value for 2022 is the same as the value for 2019 at $76.5 billion. This demonstrates that the full-service restaurant industry was able to bounce back successfully post-COVID to return to their pre-COVID level of output.
Comparing Industries Using Percent Change
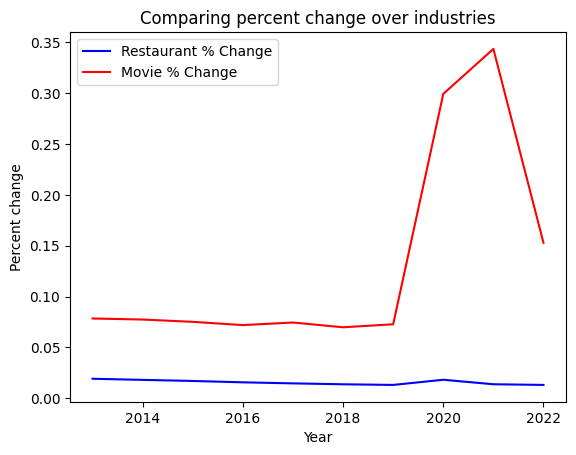
The line graph above shows percentage change over time for both the movie theater and full-service restaurant industries. This visualization involved a series of code manipulations to our dataframe, where where used the percentage change formula of (new value - previous value)/(previous value) to measure variation in a nuetral way that would not be distracted by the differences in value (in USD) of the two industries. The visualization shows a great amount of variability in the movie theater industry around the time of COVID, while the full-service restaurant industry remains much more steady even during the economic fluctations. This demonstrates the restaurant industry's ability to navigate fluctuation and recover quickly, and suggests greater struggle happening in the movie theater industry.
Based on these data sets, we have concluded that the winner in Dinner vs. Movies is . . . the full-service restaurant industry!
In the next step, we will use more data sets to uncover potential reasons why the movie theater industry is struggling to recover post-COVID.